Post 2: baby steps

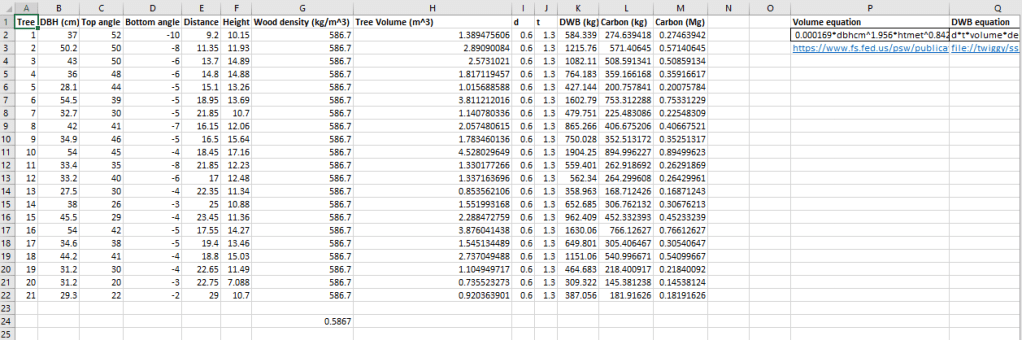
This week I hunted online for good allometric equations for calculating biomass and carbon stock of trees. I realize that I still haven’t used GIS for my GIS course project, but we’re getting there, and hey datas half the battle anyway! I finally found a good equation to calculate dry weight biomass (DWB), which is awesome because it factors below ground biomass as well as above ground. The equation is:

DWB = d*t*V*p

where d is a constant 0.56 used to convert fresh weigh to dry weight, t is a constant 1.28 that factors below-ground root mass, V is the volume of the tree in cubic meters, and p is the species-specific wood density in g/cm^3.

That meant that I had to find another equation to calculate the volume of a tree given height and diameter. Volume equations vary based on tree due to different growth patterns. I tried to find a volume equation specific to northern red oaks, but the closest I got was one that is genus-specific rather than species-specific for Quercus, or oak. The equation for volume is:

0.000169*(DBH^1.956)(height^0.842)

Using these equations and a standard biomass->carbon conversion rate of 0.47, I was able to calculate the carbon stock of each tree. Yay!

My plans for after break are to:

  • get the GPS points of each tree and add that to my excel sheet
  • upload this data as points on excel
  • convert to raster (maybe use model builder? I’d like to because I want to gain skills in it and it would be nice to have a model built since this is a pilot study)
  • I feel like I want to do something else after I get a nice carbon raster, but I can’t think of what right now. Either it’ll come to me as I do it or I’ll ask Dr. M. what she thinks.

Post 1

This past week I measured DBH and calculated the height of the 21 trees on the lawn outside of Roger Bacon.

Top angle, bottom angle, and distance weer obtained with a clinometer and distance tape and were used to estimate the tree’s height (in meters). The trigonometric equation to find the height is expressed in excel as

The wood density is a species specific value. I am pretty sure that the trees are all red oaks, which have a wood density of 0.74 g/cm^3, but I should double check I have the correct species before I progress much further.

Usually when I start a project I like to have a very clear idea of what the end product will look like. This project is different–I’m remaining open to the possibilities of what the map might look like depending on what I am able to accomplish in iTree Eco and with raster data.

I talked with Dr. M today about the possibility of displaying the map as one with graduated size points for the trees outside of RB according to their carbon stock, and she had the idea of using model builder to create a raster layer (called kernal density rasters) of carbon stock in the trees. This could be illuminating as to how carbon stock is clustered in certain parts of a plot and then could be ran on larger tree surveys. I really like this idea and I think I will pursue it. In my opinion it would make more sense to calculate carbon stock manually in excel using allometric equations, upload it as a csv, and mess around with it in ArcMap (or maybe ArcGIS Pro? I’ll ask about this soon). I found a resource for calculating the carbon stock of urban trees using known values (https://serc.carleton.edu/eslabs/carbon/1b.html) given DBH and tree species (which has corresponding numeric values based on species wood density). These estimates do not factor in height, which means they are not super robust (and, like, I have tree heights already so I might as well use them!). I will keep looking for a good allometric equation to use for oak species in NY that factor as height, but will use the methods described in the link above if that does not work.

My next steps are to: research allometric equations, confirm tree species ID, calculate above-ground biomass and then use that to find carbon stock, upload this data to ArcMap (or Pro), make a graduated size map with points corresponding to carbon stock, and then investigate how to make a kernal density map using Model Builder. Exciting stuff!!

Project Proposal

Carbon Stock of Campus Trees
Eileen Fitzgerald
Siena College
515 Loudon Road, Loudonville, NY
February 3 2020

Introduction

The global carbon cycle is a complex system of sources and sinks. The role of sinks in this system is of particular interest in determining climate change mitigation strategies, as one of the most prolific greenhouse gases is CO2. Among the most effective terrestrial carbon sinks are trees: they capture atmospheric carbon and convert it to sugar and oxygen during photosynthesis. While protecting and restoring large swaths of forested land is vital in increasing terrestrial carbon sinks, another great strategy is planting more trees in urban and suburban areas. This not only has the benefit of increased carbon storage, but also a number of other benefits such as improved air and water quality, reduced urban heat island effect, and more aesthetically pleasing neighborhoods. Being able to quantify just how much carbon is stored by trees in non-forested areas can help us understand what role urban and suburban trees can play in the global carbon cycle.

In recent years, Siena College along with colleges across the US have been placing greater emphasis on environmental sustainability–this year Siena is hosting a series of climate change lectures. I am curious about the underlying aspects of Siena’s sustainability; namely, I want to know how much carbon we release as an institution and how much is sequestered by trees on campus.

Draft note: I realize this might be overambitious in terms of data collection, but I’m shooting for the stars with this proposal and have a more safe backup plan that consists of using data from tree inventories I did for my research project in Peru, which would also be really cool.

Objectives
This project seeks to quantify and map carbon stock and other benefits posed by campus trees at Siena using iTree Eco and ArcMap

Methodology

  • Conduct a tree survey (species ID, DBH, Height) of all trees on Siena’s main campus
    • Begin this with a PILOT STUDY focusing just on trees in front of Roger Bacon Hall. If collecting data for all trees on campus is deemed unfeasible, I will adjust accordingly and use other data.
  • Upload data to iTree Eco to estimate carbon storage
  • Map carbon storage values using ArcMap
  • Compare these values to Siena’s carbon footprint and calculate the proportion of Siena’s carbon footprint that is offset by Siena’s trees.

Data Sources

  • I will be generating my own data and mapping against a basemap from ArcMap’s database

Work Plan and Deliverables

Week of 2/3: Start inventorying campus trees

Week of 2/10: Finish inventory and input data Deliverable: campus tree inventory

Week of 2/17: Upload data to iTree Eco and start obtaining carbon stock and other data outputs from the software

Week of 2/24: Transfer data to ArcMap Deliverable: carbon storage values for Siena’s campus’ trees

Week of 3/2: Start mapping carbon data

Week of 3/23: Finish map(s) and start data table Deliverable: Map of carbon storage by Siena’s campus trees

Week of 3/30: Finish data table Deliverable: data table

Week of 4/6: Create poster Deliverable: Poster

Design a site like this with WordPress.com
Get started